Key Takeaways
- Trump threatens to Cut Elon Musk’s Government Contracts
- Trump and Chinese President Xi Jinping continue their trade negotiations
- Microsoft hits a new record high at $468.5 per share. Market cap breaks $3.48 trillion.
- Oil prices rose more than 3% this week despite output increase by OPEC+
- Silver surges to a 13-year high after breaking crucial $35/ounce level.
Elon Musk Attacks Trump and Criticizes his budget bill, Trump Fires Back
Once close allies who frequently appeared together, Donald Trump and Elon Musk’s relationship has suddenly soured. The U.S. president threatened to withdraw government contracts from Musk’s companies, while the Tesla CEO claimed credit for Trump’s election victory. The dispute erupted over Musk’s criticism of a Republican spending bill, escalating into a social media clash that drew reactions from business and political figures. Tesla shares fell 14% amid the conflict.
US-China Trade Negotiations Continue
President Donald Trump and Chinese President Xi Jinping held a 90-minute call on Thursday, 5 June 2025, focused on trade, agreeing to resume official talks. Treasury Secretary Bessent, Commerce Secretary Lutnick and Trade Representative Greer will lead U.S. negotiations. The last meeting in Geneva saw both sides lower tariffs temporarily, though tensions remain over rare earth exports.
Recent friction points include U.S. restrictions on Chinese student visas and semiconductor regulations, which China views as undermining progress. The Trump administration maintains these measures are for national security. Stocks fluctuated on news of the call. Trump described it as very positive and noted Xi’s invitation for a state visit.
US Indices Rise This Week
Stock market futures held steady Thursday evening before Friday’s key jobs report. S&P 500 futures were flat, Dow futures rose 0.1%, and Nasdaq 100 futures dipped 0.1%.
Recent data suggests an economic slowdown, raising questions about tariffs and Fed policy.
Major indexes remain positive for the week: Dow Jones is up 0.87%, S&P500 gained 1.25% and Nasdaq is up 1.76%.
Oil Prices
Oil prices are rising despite an expected market oversupply in coming weeks, barring U.S.-Iran tensions. OPEC+ plans to add 1.2 million barrels of supply between May and July, exceeding 2025’s projected demand growth.
J.P. Morgan projects a 2.6 million barrel daily surplus by Q4, yet prices remain resilient. The futures market shows near-term strength through backwardation, but shifts bearish by May 2026.
The U.S.-Iran relationship remains the key risk factor. Failed negotiations could remove 1.5 million barrels of Iranian exports through sanctions, potentially raising prices $5-10 per barrel.
Silver surges past $35/oz level to hit a more than 13-year high
Silver hit $35 per ounce, its highest in over 13 years, driven by strong industrial demand and supply shortages.
Spot silver climbed 2.5% to $35.82 per ounce, peaking at $36.08, the highest since February 2012.
The gold-silver ratio is at 94, down from April’s high of 105, indicating silver’s increasing value relative to gold.
Silver, both safe-haven and industrial metal, is up 24% in 2025, with industrial uses comprising over half of global demand. Demand remains strong despite industrial headwinds, particularly in solar and electrification sectors.
Silver faces its fifth consecutive supply deficit year, though expected to narrow by 21% in 2025.
Key Economic Data of the week
- JOLTS job openings in the US rose to 7.39 million in April, better than expectations of 7.1 million
- Australian GDP grows by only 0.2% in the first quarter of the year, lower than expectations
- ADP Private payrolls increased by only 37,000 in May, the lowest since March 2023.
- ECB lowers interest rates by 25 basis points, in line with expectations.
- ISM Manufacturing PMI in the US come at 48.5, lower than expectation of 49.3
- CPI numbers in Switzerland came as expected at 0.1%
Major Economic Calendar Events for the Upcoming Week
| Monday, 9 June | Final GDP q/q | Japan |
| Tuesday, 10 June | Unemployment Rate | UK |
| Wednesday, 11 June | Consumer Price Index y/y | USA |
| Thursday, 12 June | Gross Domestic Product m/m | UK |
| Thursday, 12 June | Producer Price Index m/m | USA |
| Thursday, 12 June | Unemployment Claims | USA |
| Friday, 13 June | Consumer Sentiment | USA |
| Friday, 13 June | Inflation Expectations | USA |
Technical Analysis and Forecast:
EURUSD continues moving in an uptrend as the US dollar weakens
EURUSD has been in a strong uptrend since the beginning of the year, going up from a low of 1.0177, as it forms a series of higher highs and higher lows. The recent swing high at 1.15731 acts as a key resistance. The pair is now moving in a weak uptrend just below this resistance.
Moving averages support short-term bullish momentum. MA(5) is currently above MA(10) and MA(30). MA(10) is also trending upward, supporting the bullish structure. And MA(30) is significantly below current price, confirming a strong medium-term uptrend.
The price is using MA(5) and MA(10) as dynamic support during pullbacks. The MACD line is above the signal line, but the histogram is weakening, showing that bullish momentum is slowing. No bearish crossover yet, but flattening MACD lines suggest possible short-term exhaustion.
A daily close above 1.1573 could trigger a continuation toward 1.1620–1.1700 levels. However, If price rejects this resistance and MACD crosses down, a correction toward 1.1320–1.1280 is possible.
EURUSD Daily Chart
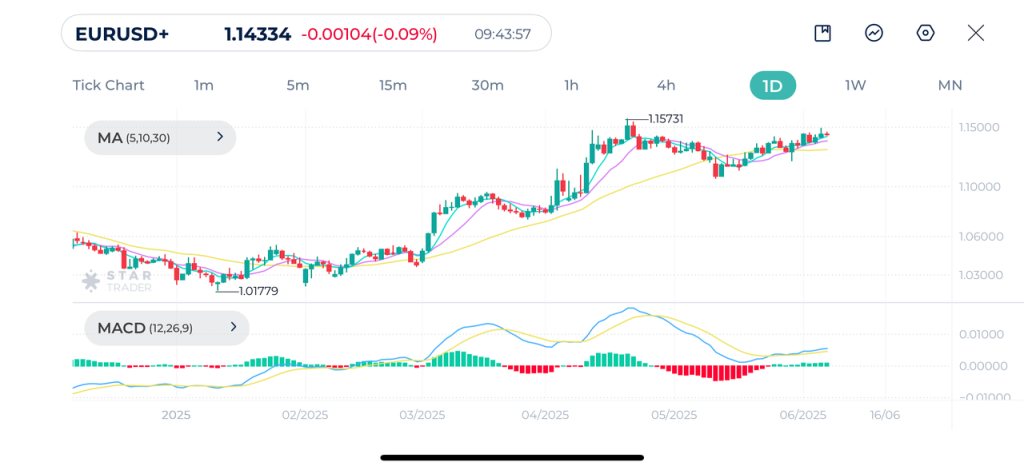
| Resistance | 1.1575 | 1.1696 | 1.1771 |
| Support | 1.1356 | 1.1213 | 1.1132 |
Gold prices fluctuate near historic highs
Gold (XAUUSD) Daily Chart(XAUUSD)
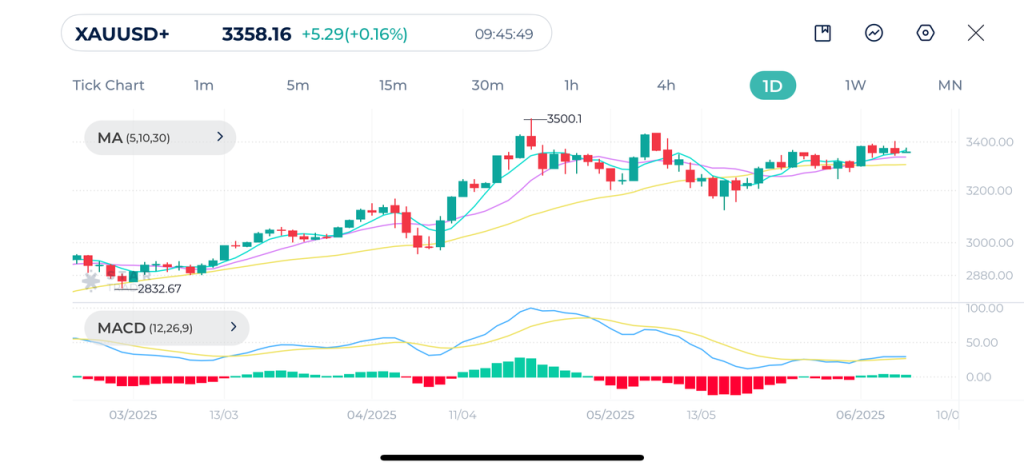
Gold has been trading in consolidation since hitting the all-time high of $3,500 earlier this year. Price is now consolidating between $3,300 and $3,400. While the long-term uptrend remains intact, signs of exhaustion near the top are visible.
MA(5) and MA(10) have recently flattened, showing sideways movement. MA(30) stays largely below daily candles, indicating that momentum has slowed but uptrend remains active.
The price is bouncing off the $3,300–$3,320 area, and failing to close below the dynamic support MA(30)
MACD shows attempted bullish crossover after a period of bearish correction, but signals are indicesive on the indicator.
A clear breakout above $3,420 could reinitiate the move toward $3,500. If resistance holds and MACD weakens again, a retest of $3,300 or $3,200 is likely before the next bullish run.
| Resistance | $3,405 | $3,434 | 3,460 |
| Support | $3,292 | $3,244 | $3,205 |
GBPUSD remains in bullish momentum after breaking 3-year high
The British Pound has maintained its uptrend since the beginning of the year. The pair continues to build higher highs and higher lows on the daily chart.
Moving averages are trending upward with MA(5) and MA(10) very close to current prices indicating short-term indecision or consolidation. MA(30) remains well below price, suggesting the trend is still strong. The price is respecting dynamic support levels on pullbacks, which indicates uptrend is still strong.
MACD is still bullish but flattening, and the histogram bars are shrinking, indicating a loss in bullish momentum, though no bearish crossover yet.
The bullish trend is intact, but MACD and price action suggest possible short-term consolidation. If 1.3613 is broken with daily candle closure above the level, next target is 1.3700. A pullback to 1.3450–1.3400 with bullish reversal candlestick formations is likely to push price upward.
GBPUSD Daily Chart
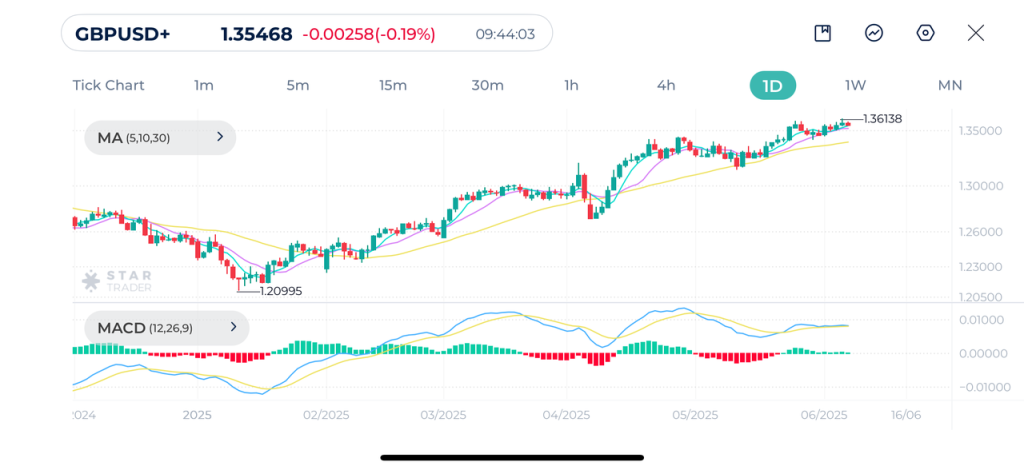
| Resistance | 1.3617 | 1.3700 | 1.3764 |
| Support | 1.3450 | 1.3417 | 1.3335 |
Tags
Open Live Account
Please enter a valid country
No results found
No results found
Please enter a valid email
Please enter a valid verification code
1. 8-16 characters + numbers (0-9) 2. blend of letters (A-Z, a-z) 3. special characters (e.g, !a#S%^&)
Please enter the correct format
Please tick the checkbox to proceed
Please tick the checkbox to proceed
Important Notice
STARTRADER does not accept any applications from Australian residents.
To comply with regulatory requirements, clicking the button will redirect you to the STARTRADER website operated by STARTRADER PRIME GLOBAL PTY LTD (ABN 65 156 005 668), an authorized Australian Financial Services Licence holder (AFSL no. 421210) regulated by the Australian Securities and Investments Commission.
CONTINUEImportant Notice for Residents of the United Arab Emirates
In alignment with local regulatory requirements, individuals residing in the United Arab Emirates are requested to proceed via our dedicated regional platform at startrader.ae, which is operated by STARTRADER Global Financial Consultation & Financial Analysis L.L.C.. This entity is licensed by the UAE Securities and Commodities Authority (SCA) under License No. 20200000241, and is authorised to introduce financial services and promote financial products in the UAE.
Please click the "Continue" button below to be redirected.
CONTINUEError! Please try again.