Market news summary
U.S. Dollar Index (USDX)
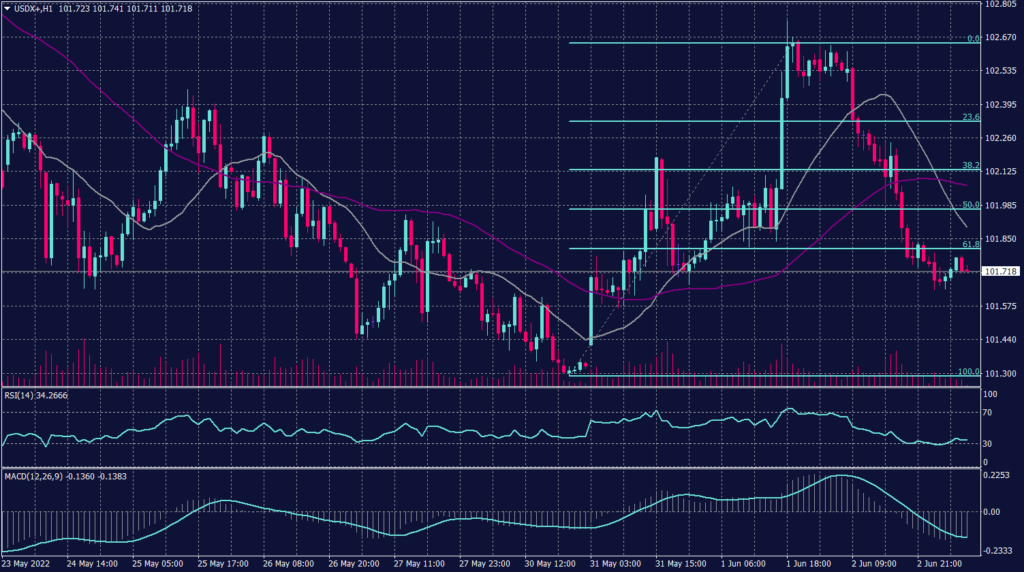
Market participants focus on the upcoming U.S. labor data that is due on Friday, which is considered crucial for the Fed rate anticipations. The upcoming employment report is likely to show the tight labor market, to shift to more modest payroll growth.
The Non-farm figures are likely to increase by about 325,000, 103,000 less than the previous month. While still strong, the projected advance would be the smallest in over a year. In the meantime, the unemployment rate is seen falling to a pandemic low of 3.5%, and average hourly earnings are forecast to rise 0.4% from a month earlier.
Technically:
The U.S. dollar index fluctuated between the resistance of 102.60 and the support of 101.60. Meanwhile, on the daily chart, the USDX is trying to break away from the declining trendline, but it remains bearish for the time being.
On the hourly chart, 20 SMA and 55 SMA intersect, and both are above the current price range which signals a slight fluctuation on the way down.
PIVOT POINT: 101.70
| SUPPORT | RESISTANCE |
| 101.60 | 101.90 |
| 101.30 | 102.60 |
| 101.40 | 102.80 |
Euro (EURUSD)
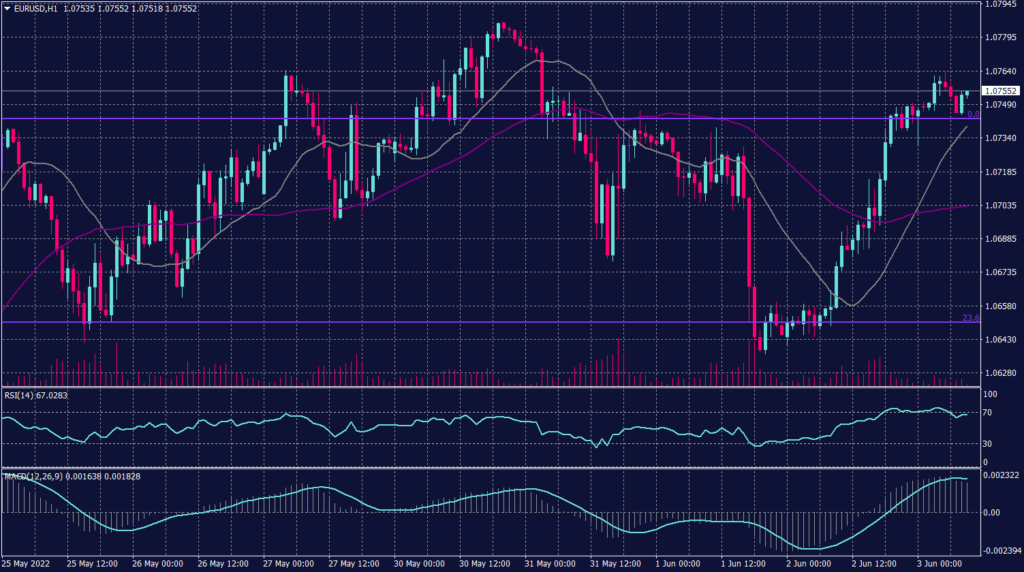
The Euro posted gains as the greenback weakened yesterday, but the pair remained stable during the early trades.
However, Fibonacci retracement shows resistance1.0750 while technical indicators show a possibility of a decline. Though, moving averages show a change in direction and set a target at 1.0700.
PIVOT POINT: 1.0750
| SUPPORT | RESISTANCE |
| 1.0700 | 1.0790 |
| 1.0650 | 1.0830 |
| 1.0610 | 1.0900 |
Sterling Pounds (GBPUSD)
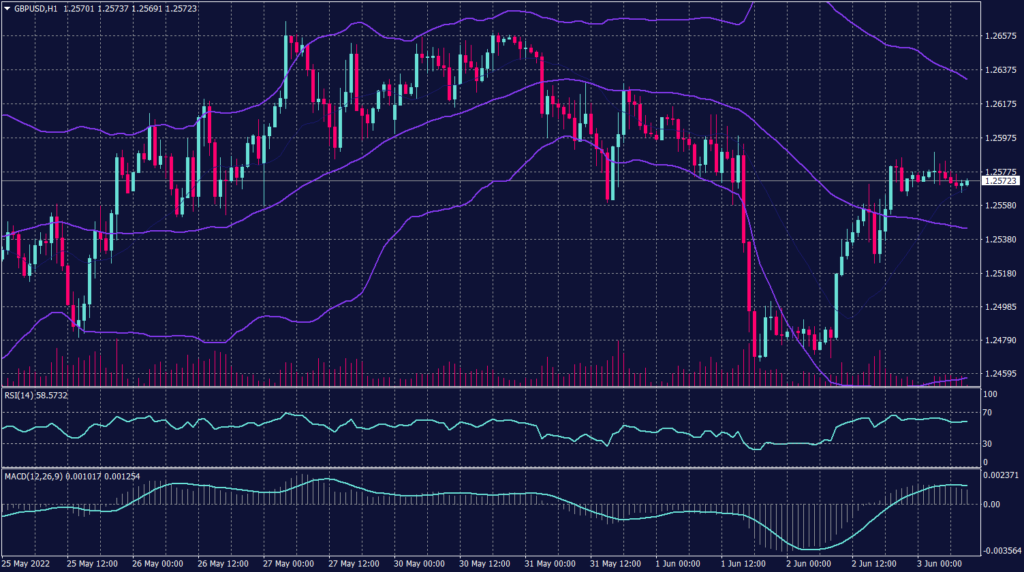
The Sterling traded steadily near 1.2780 and is trading above the intersection of the 20 SMA and 55 SMA which signals a decline towards 1.2540. In the meantime, on the Daily chart, the pair is set for a decline in the longer time frame and remains near the daily resistance of 1.2540.
PIVOT POINT: 1.2500
| SUPPORT | RESISTANCE |
| 1.2480 | 1.2540 |
| 1.2450 | 1.2570 |
| 1.2400 | 1.2600 |
Spot Gold (XAUUSD)
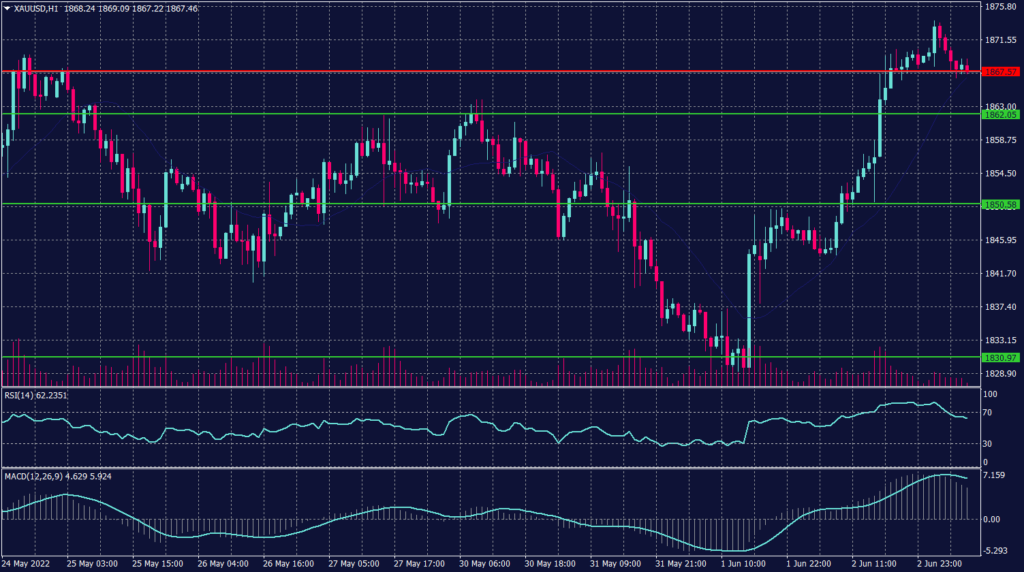
Gold jumped yesterday reaching above 1,870 and it started to retreat during today’s early trades. Gold prices are set for a decline towards 1,815 on the daily chart. Meanwhile, in the hourly chart, spot gold penetrated out of the regression channel, but it remains set to decline.
On the daily chart, the precious metal returns to its primary decline trend targeting the resistance at 1,810 and 1,790. However, spot gold shows a change in direction and signals further decline below the support at 1,842 during the day.
PIVOT POINT: 1,866
| SUPPORT | RESISTANCE |
| 1,852 | 1,872 |
| 1,842 | 1,875 |
| 1,830 | 1,888 |
Tags
Open Live Account
Please enter a valid country
No results found
No results found
Please enter a valid email
Please enter a valid verification code
1. 8-16 characters + numbers (0-9) 2. blend of letters (A-Z, a-z) 3. special characters (e.g, !a#S%^&)
Please enter the correct format
Please tick the checkbox to proceed
Please tick the checkbox to proceed
Important Notice
STARTRADER does not accept any applications from Australian residents.
To comply with regulatory requirements, clicking the button will redirect you to the STARTRADER website operated by STARTRADER PRIME GLOBAL PTY LTD (ABN 65 156 005 668), an authorized Australian Financial Services Licence holder (AFSL no. 421210) regulated by the Australian Securities and Investments Commission.
CONTINUEImportant Notice for Residents of the United Arab Emirates
In alignment with local regulatory requirements, individuals residing in the United Arab Emirates are requested to proceed via our dedicated regional platform at startrader.ae, which is operated by STARTRADER Global Financial Consultation & Financial Analysis L.L.C.. This entity is licensed by the UAE Securities and Commodities Authority (SCA) under License No. 20200000241, and is authorised to introduce financial services and promote financial products in the UAE.
Please click the "Continue" button below to be redirected.
CONTINUEError! Please try again.