The dollar paused in what has been a relentless climb higher as the euro and even the besieged Japanese yen and British pound managed to recover a little ground, but medium-term fundamentals were still in the greenback’s favor.
U.S. Dollar Index (USDX)
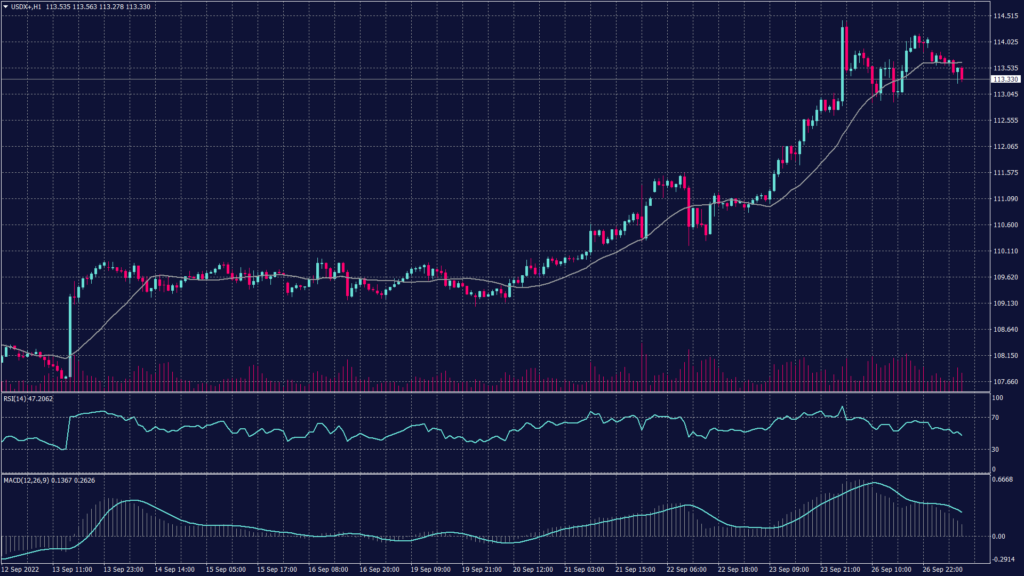
The dollar index was at 112.39, down 0.7% on the day, with the decline in the safe haven broadly in line with a recovery in markets’ sentiment towards riskier assets, which also boosted European stocks and U.S. share futures.
Technically, the index remains positive on both the daily and hourly charts after exceeding the 114 level. However, despite the slowdown on the hourly chart towards 113, the technical indicators remain positive and signal a bullish trend after the correction to 112.90.
Pivot Point: 113.60
| SUPPORT | RESISTANCE |
| 112.90 | 113.80 |
| 112.75 | 114.10 |
| 112.60 | 114.20 |
Euro (EURUSD)
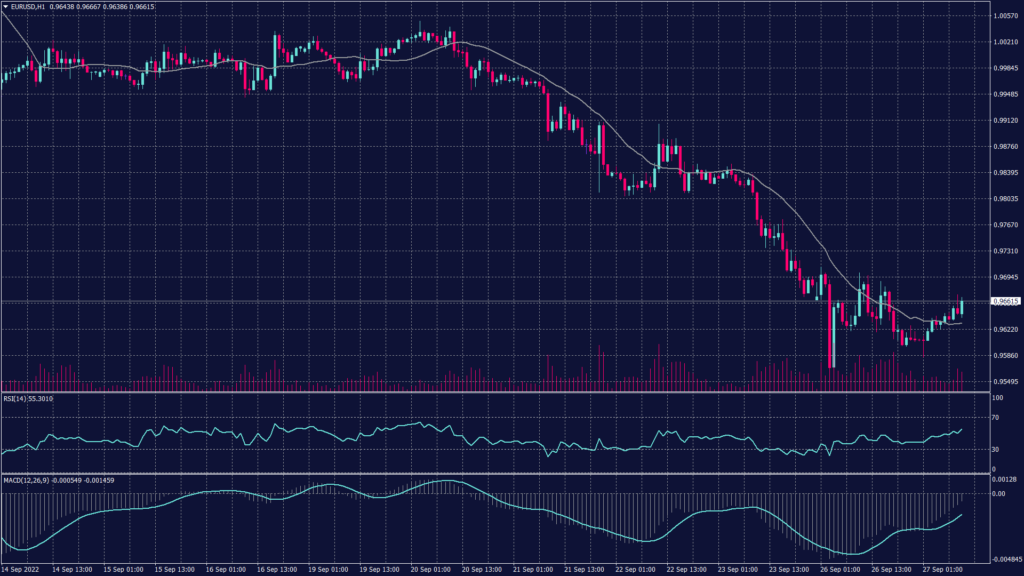
Euro zone government bond yields rose to new multi-year highs on Tuesday as investors positioned for more interest rate rises and the impact of the UK’s “mini-budget” continued to reverberate around financial markets. In early European trading, yields rose between 2 and 5 basis points in most markets, with the German 10-year yield briefly at a new nearly 11-year high of 2.142%.
The daily chart is showing heavy pressure below the parity levels and confirms the downtrend towards 0.9500. The hourly chart signals further decline with no strong support.
Pivot Point: 0.9685
| SUPPORT | RESISTANCE |
| 0.9655 | 0.9730 |
| 0.9550 | 0.9770 |
| 0.9500 | 0.9820 |
Sterling Pound (GBPUSD)
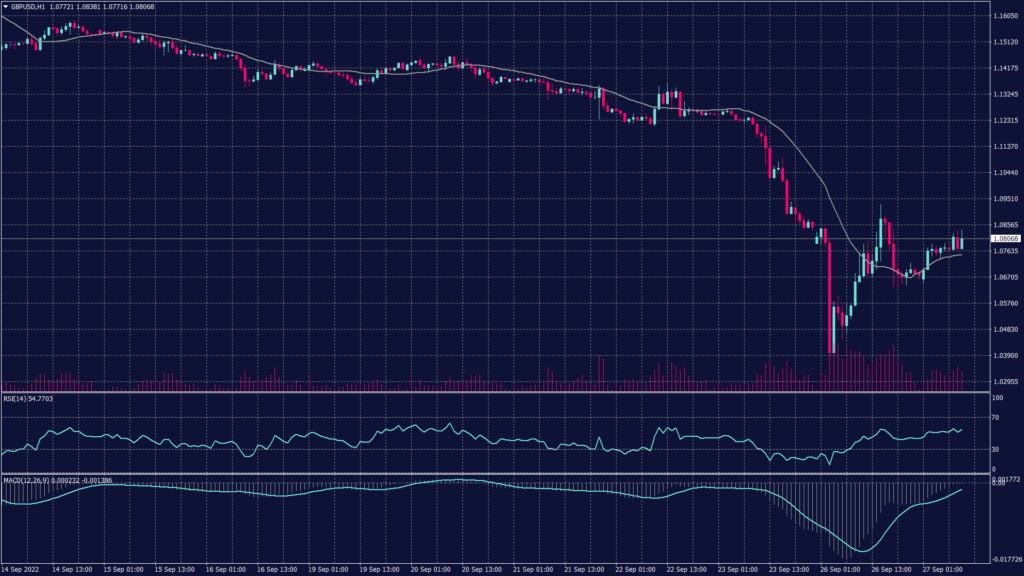
Sterling was not too far from its record low against the dollar of $1.0327 hit Monday, the end of a plunge that began Friday when markets were spooked by Britain’s gambit of relying on unfunded tax cuts to spur growth, which also sent short-term gilt yields up 100 bps in two days.
Technically, the cable remains negative below the level of 1.0830 despite the correction from 1.0290 and signals a possible decline from 1.0830. The technical indicators show a slowdown in the downtrend while remaining far from changing the direction. Meanwhile, the daily chart is also negative and MACD is showing a possibility of further decline towards the parity levels.
Pivot Point: 1.0775
| SUPPORT | RESISTANCE |
| 1.0700 | 1.0830 |
| 1.0610 | 1.0950 |
| 1.0415 | 1.1110 |
Spot Gold (XAUUSD)
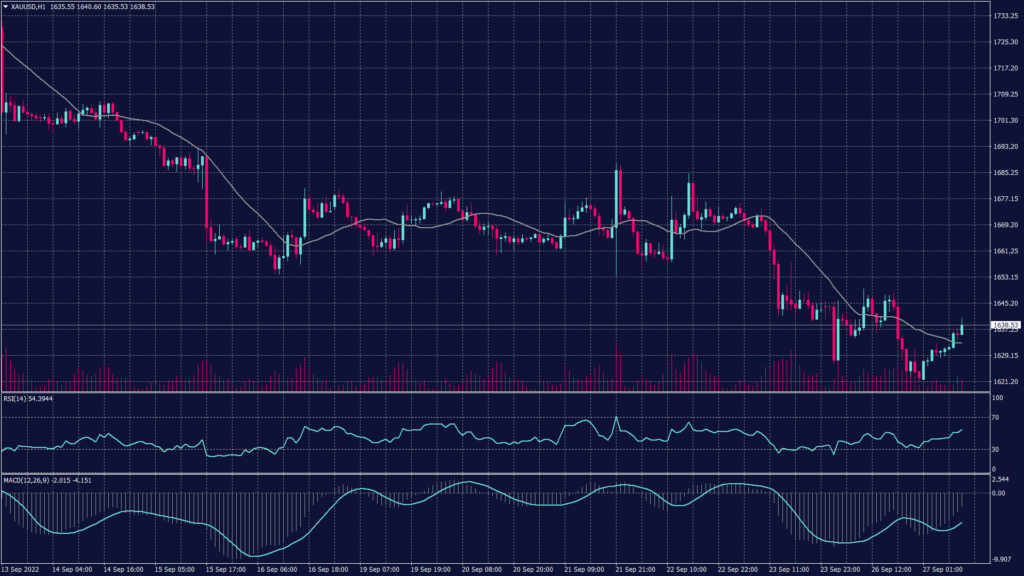
Technically, the precious metal remains under selling pressure below $1,650 per ounce on the hourly chart. However, technical indicators show a possibility of fluctuation and a slight rebound to 1,650 during the European session.
Pivot Point: 1,635
| SUPPORT | RESISTANCE |
| 1,628 | 1,650 |
| 1,620 | 1,656 |
| 1,600 | 1,663 |
Tags
Open Live Account
Please enter a valid country
No results found
No results found
Please enter a valid email
Please enter a valid verification code
1. 8-16 characters + numbers (0-9) 2. blend of letters (A-Z, a-z) 3. special characters (e.g, !a#S%^&)
Please enter the correct format
Please tick the checkbox to proceed
Please tick the checkbox to proceed
Important Notice
STARTRADER does not accept any applications from Australian residents.
To comply with regulatory requirements, clicking the button will redirect you to the STARTRADER website operated by STARTRADER PRIME GLOBAL PTY LTD (ABN 65 156 005 668), an authorized Australian Financial Services Licence holder (AFSL no. 421210) regulated by the Australian Securities and Investments Commission.
CONTINUEImportant Notice for Residents of the United Arab Emirates
In alignment with local regulatory requirements, individuals residing in the United Arab Emirates are requested to proceed via our dedicated regional platform at startrader.ae, which is operated by STARTRADER Global Financial Consultation & Financial Analysis L.L.C.. This entity is licensed by the UAE Securities and Commodities Authority (SCA) under License No. 20200000241, and is authorised to introduce financial services and promote financial products in the UAE.
Please click the "Continue" button below to be redirected.
CONTINUEError! Please try again.