Market News Summary
U.S. dollar at five years high
Euro towards 1.0325
Gold is at a critical level
Crude oil under supply pressure
Euro (EURUSD)
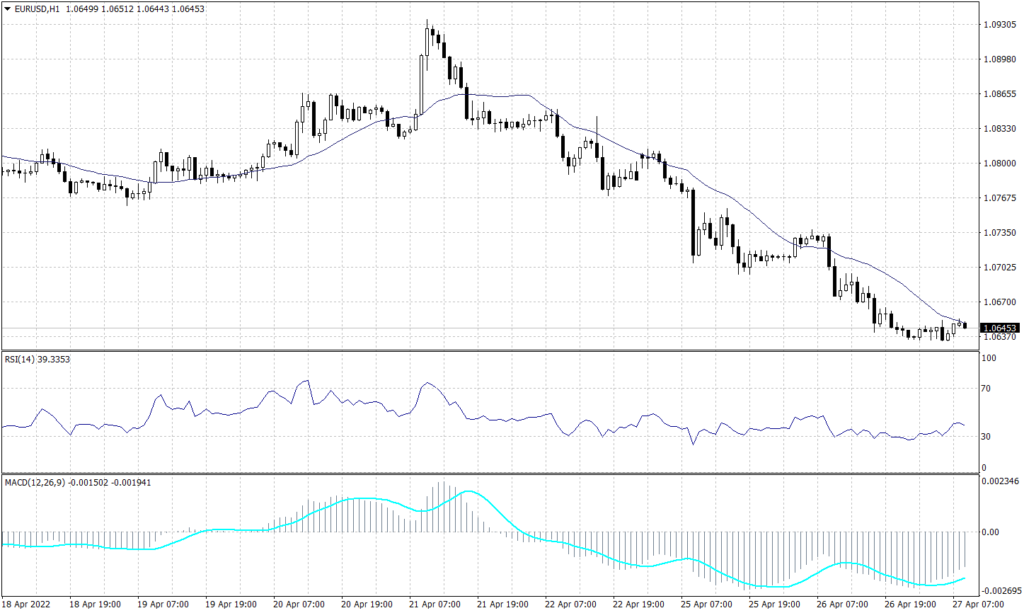
The common currency is under unrelenting pressure as its counterparty is on a rocketing breakout. EUR/USD has cracked the 2020 lows of 1.0635 and heading towards the five-year low of 1.0600.
The pair is not showing any signs of recovery, but it is showing signs of targeting 1.0635 on the hourly chart. Meanwhile, on the longer time frame, the pair shows a possibility to reach 1.0325. Technical indicators show a slight swing along the way but remain confirming the downward trend.
PIVOT POINT: 1.0640
| R1 | R2 | R3 | |
| RESISTANCE | 1.0665 | 1.0730 | 1.0750 |
| S1 | S2 | S3 | |
| SUPPORT | 1.0605 | 1.0570 | 1.0530 |
Japanese Yen (USDJPY)
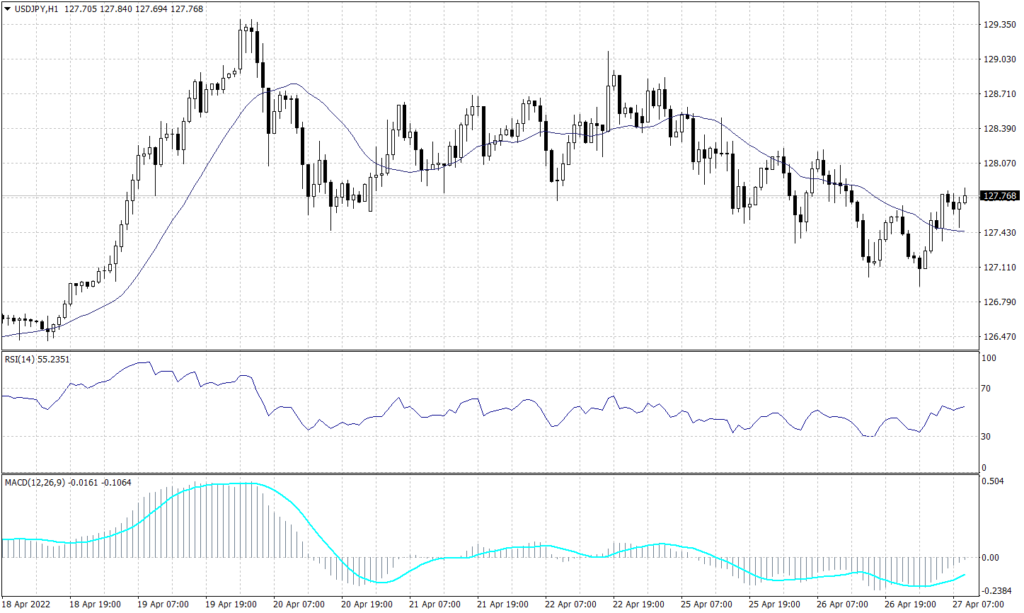
The Japanese Yen found slight support below 128 during the Asian session today. However, USDJPY is expected to remain under 128.40 during the day as the resistance gets more intense. Price action shows a possibility for further decline towards 127.10 while the technical indicators signal a bounce towards 128.40.
PIVOT POINT: 127.70
| R1 | R2 | R3 | |
| RESISTANCE | 128.00 | 128.15 | 128.40 |
| S1 | S2 | S3 | |
| SUPPORT | 127.60 | 127.40 | 127.10 |
Gold (XAUUSD)
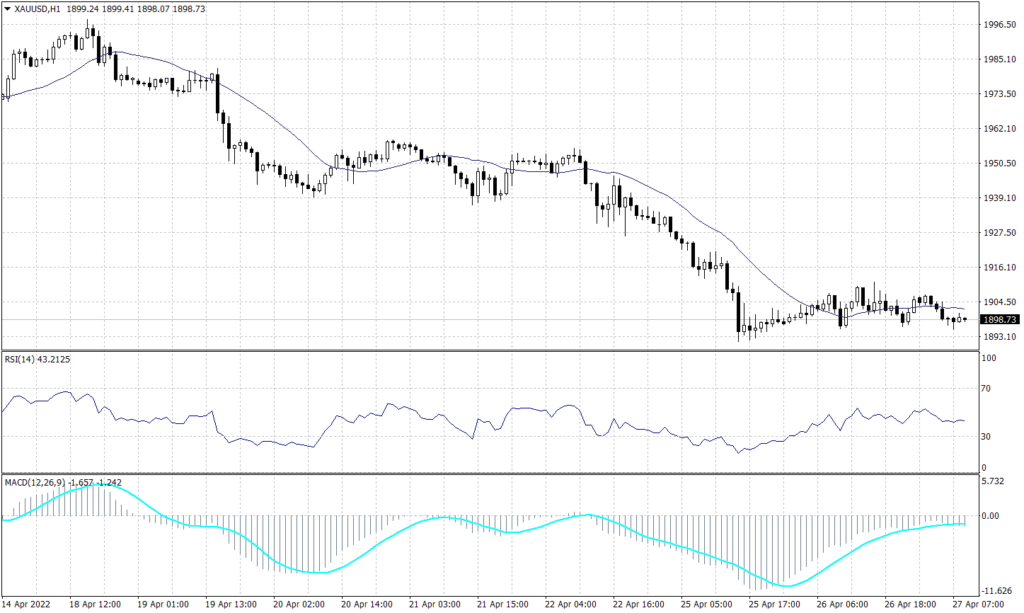
The precious metal is seen to remain bearish as it was traded below $1,900 during the early trades. The gold is expected to move towards 1,850 over the long run unless it bounced back above $1,920. In the short term, XAUUSD remains supported above $1,890. However, if the price broke below $1,890, it is expected to see the prices near $1,850. Technical indicators show a further drop towards $1,890 during the day.
PIVOT POINT: 1,900
| R1 | R2 | R3 | |
| RESISTANCE | 1,905 | 1,910 | 1,920 |
| S1 | S2 | S3 | |
| SUPPORT | 1,897 | 1,895 | 1,890 |
Dow Jones (US30)
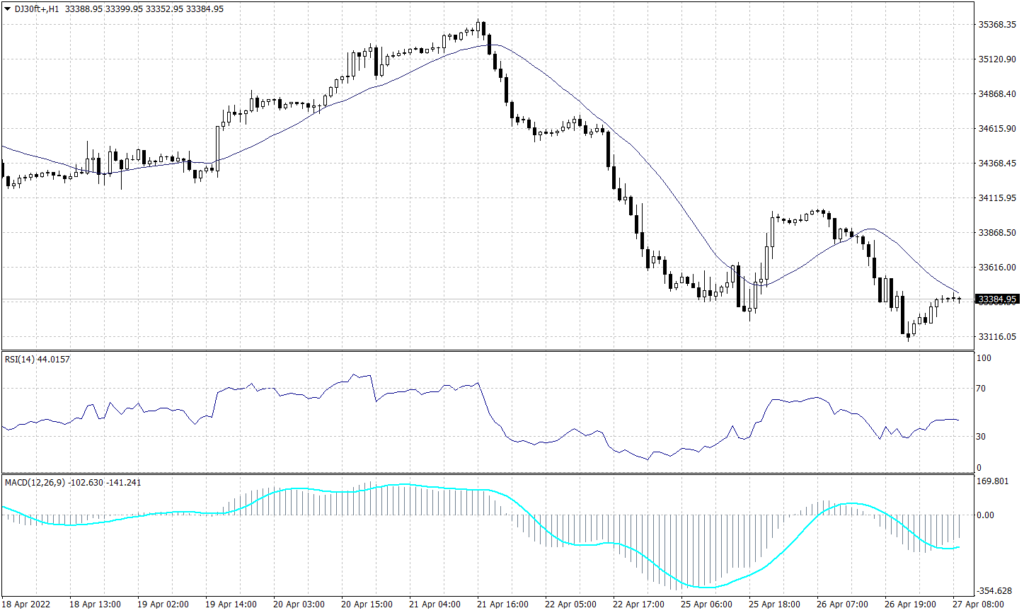
The long-term view of the Dow Jones shows a further decline after breaking below the support at 34,300. Furthermore, the U.S. blue-chip is expected to decline to 32,700. Meanwhile, the short-term chart shows support above 33,400. Technically, the Dow Jones is expected to fluctuate around 33,400 with a tendency to fall towards 33,230.
PIVOT POINT: 33,500
| R1 | R2 | R3 | |
| RESISTANCE | 33,675 | 33,900 | 34,150 |
| S1 | S2 | S3 | |
| SUPPORT | 33,230 | 33,030 | 32,840 |
WTI (USOUSD)
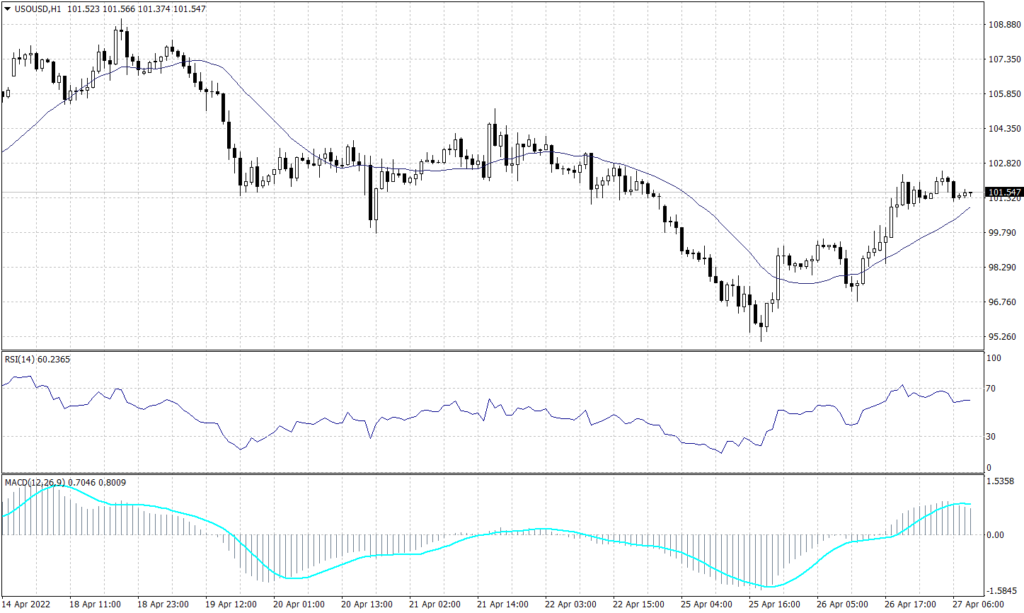
WTI fluctuated in a range between $95 and $105 since March 28 while keeping the negative outlook and the possibility of moving towards $90 if the price broke below $95. The short-term chart however shows strong support above $101.50 due to the current supply worries. Technical indicators show a high tendency to fall towards $98.80 during the day.
PIVOT POINT: 101.50
| R1 | R2 | R3 | |
| RESISTANCE | 102.50 | 102.80 | 103.30 |
| S1 | S2 | S3 | |
| SUPPORT | 101.20 | 98.80 | 98.20 |
Tags
Open Live Account
Please enter a valid country
No results found
No results found
Please enter a valid email
Please enter a valid verification code
1. 8-16 characters + numbers (0-9) 2. blend of letters (A-Z, a-z) 3. special characters (e.g, !a#S%^&)
Please enter the correct format
Please tick the checkbox to proceed
Please tick the checkbox to proceed
Important Notice
STARTRADER does not accept any applications from Australian residents.
To comply with regulatory requirements, clicking the button will redirect you to the STARTRADER website operated by STARTRADER PRIME GLOBAL PTY LTD (ABN 65 156 005 668), an authorized Australian Financial Services Licence holder (AFSL no. 421210) regulated by the Australian Securities and Investments Commission.
CONTINUEImportant Notice for Residents of the United Arab Emirates
In alignment with local regulatory requirements, individuals residing in the United Arab Emirates are requested to proceed via our dedicated regional platform at startrader.ae, which is operated by STARTRADER Global Financial Consultation & Financial Analysis L.L.C.. This entity is licensed by the UAE Securities and Commodities Authority (SCA) under License No. 20200000241, and is authorised to introduce financial services and promote financial products in the UAE.
Please click the "Continue" button below to be redirected.
CONTINUEError! Please try again.