U.S. Dollar Index (USDX)
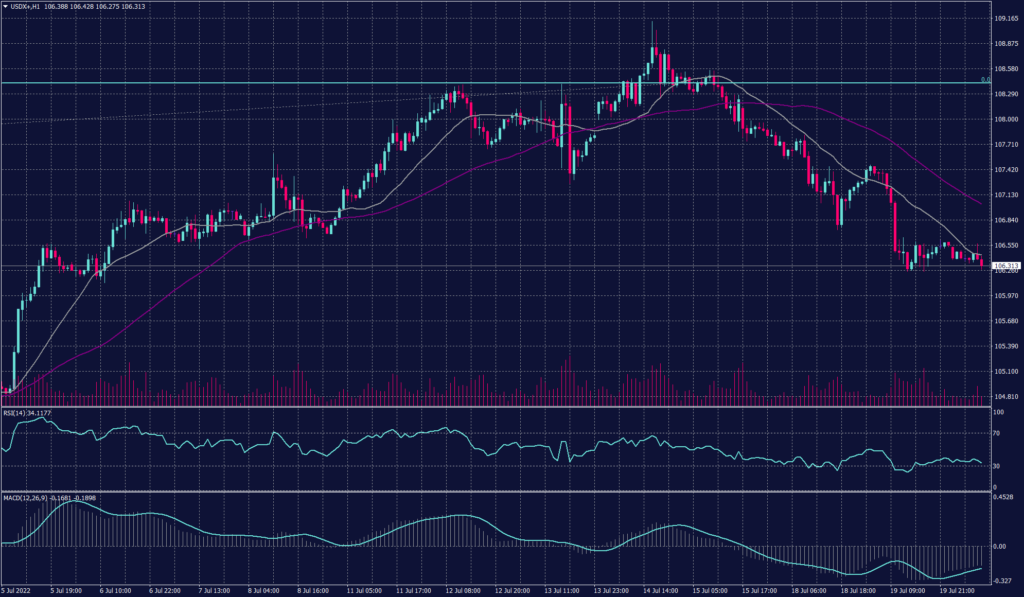
The greenback retreated further on Wednesday as major currencies extended their overnight gains with lower inflationary fears. The U.S. dollar index was down 0.14% to 106.52, well off its two-decade peak of 109.29 last week. The dollar retreat has also coincided with reduced expectations of a supersized 100-basis-point rate hike at next week’s Federal Reserve policy review.
The U.S. dollar index was green early in the day but went back as market liquidity declines. The trading momentum also declined as fears of recession rise. The index traded in lower volume during the early session below the support at 106.20.
On the hourly chart, technical indicators show a possibility of continuation to the downtrend as RSI is heading to 30 and MACD is curving away from the intersection. Meanwhile, the daily chart signals a slight decline just below 107 and then bounces above 108.20.
PIVOT POINT: 106.40
| SUPPORT | RESISTANCE |
| 106.20 | 106.85 |
| 105.95 | 107.40 |
| 105.40 | 107.70 |
Euro (EURUSD)
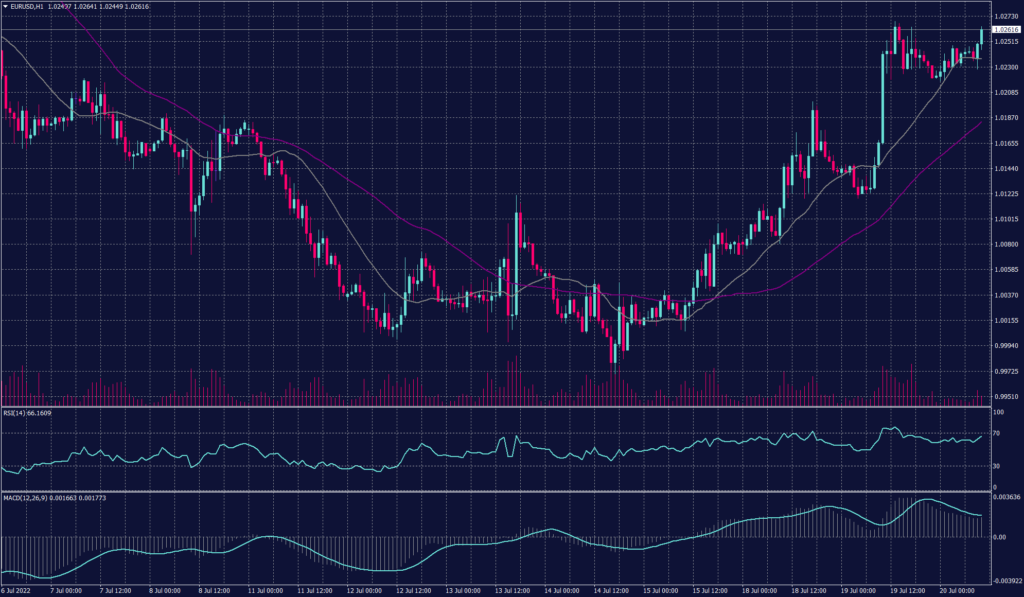
The euro slipped 0.08% after adding around 0.6% overnight for the second day of gains. However, the common currency slid as low as $0.9952 on Thursday for the first time since December 2002, pressured by uncertainty about a potential energy supply crunch in the eurozone. Despite the uncertainty, investors expect ECB to raise interest rates on Thursday for the first time in more than a decade.
Meanwhile, the hourly chart reflects a corrective movement in a long secondary trend targeting 1.0260 as the next resistance. However, the daily chart remains to hold the negative trend aiming towards 0.9960.
PIVOT POINT: 1.0230
| SUPPORT | RESISTANCE |
| 1.0100 | 1.0270 |
| 0.9960 | 1.0350 |
| 0.9850 | 1.0470 |
Sterling Pound (GBPUSD)
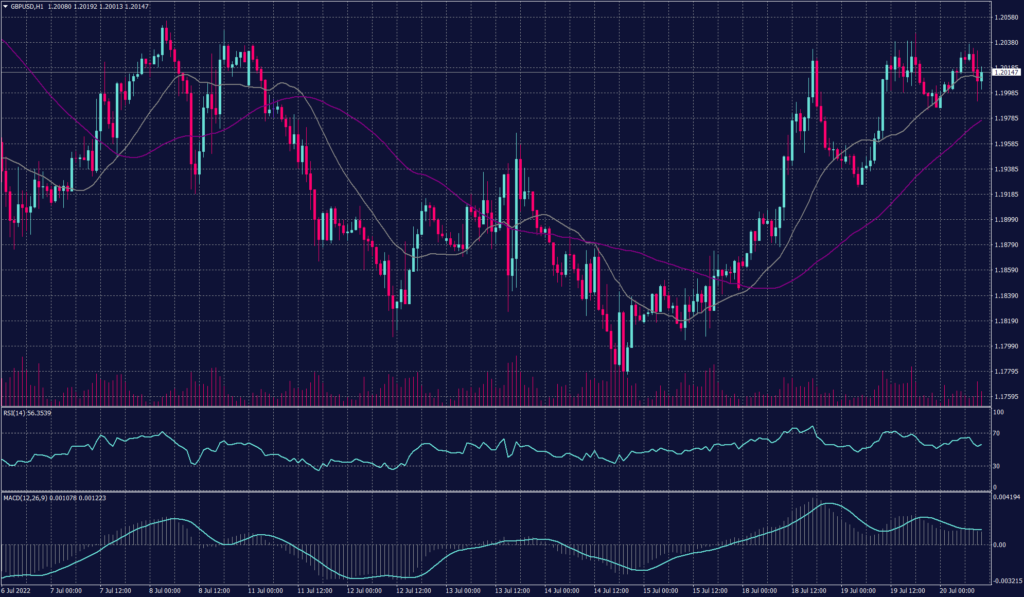
U.K. inflation rose to its highest in 40 years in June, as big monthly rises at both the consumer and producer price levels pointed to continued strong price pressure. Consumer prices rose 0.8% on the month, a shade more than the 0.7% expected, driving the annual rate to 9.4%, from 9.1%.
At the producer level, factory gate prices moderated a little, but by less than hoped, rising 1.4% on the month. That took the annual rate of producer price inflation up to 16.5% from 15.8% in May.
The pound weakened on the news, falling around 0.3% of a cent to trade just below $1.2000 during the early trades. The hourly chart shows a negative movement towards the support at 1.19860 while the daily chart remains negative despite the four day bullish run.
PIVOT POINT: 1.19500
| SUPPORT | RESISTANCE |
| 1.19860 | 1.20200 |
| 1.19580 | 1.20400 |
| 1.19260 | 1.22030 |
Spot Gold (XAUUSD)
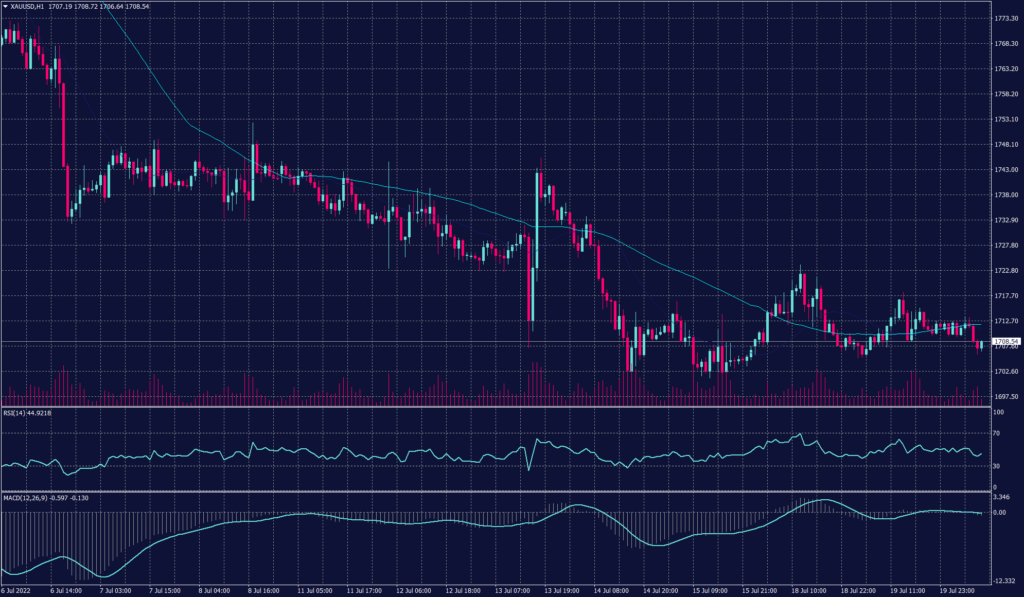
Gold remains holding near an 11-month low as investors weigh the U.S. dollar’s retreat against rising Treasury yields. Meanwhile, bullion has been stuck in a narrow trading range as a gauge of the greenback extended losses. Treasuries held a decline that’s taken the 10-year yield back above 3%. Holdings in gold-backed exchange-traded funds have dropped for 15 days, the longest stretch since March 2021.
Gold continued the trade below the support at $1,710 per ounce this morning in Asia and shows a possibility to hit 1,700 sooner than anticipated. The daily chart, however, shows a continuation of the negative trend towards $1,680.
PIVOT POINT: 1,707
| SUPPORT | RESISTANCE |
| 1,700 | 1,715 |
| 1,680 | 1,720 |
| 1,675 | 1,732 |
West Texas Crude (USOUSD)
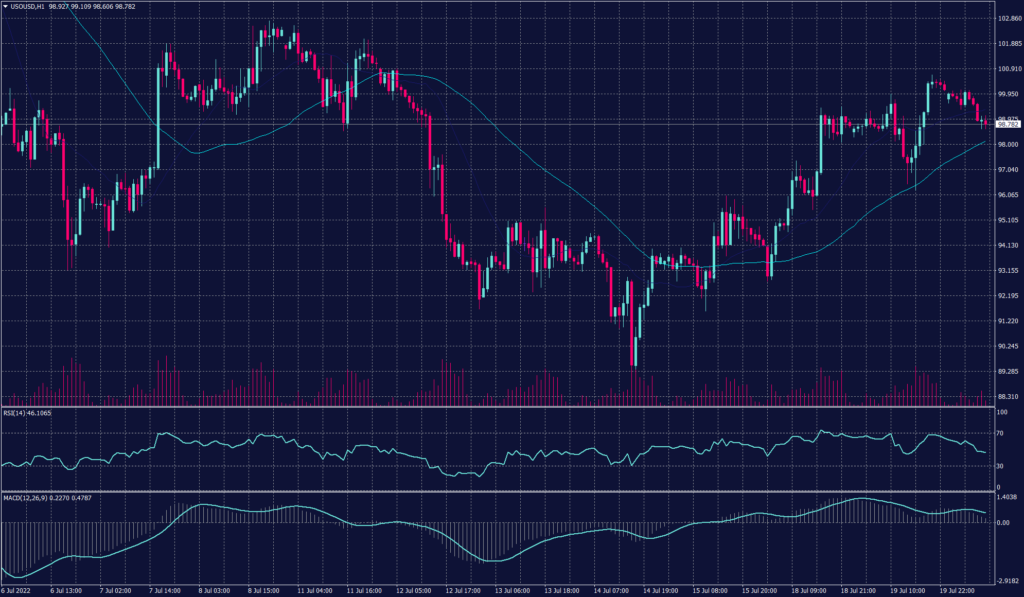
Oil fell after a three-day climb as market participants analysed data suggesting to a rise in U.S. inventories and the outlook for the dollar. West Texas Intermediate edged lower in early Asian trading after rising more than 8% in the prior three sessions.
Crude has fluctuated around $100 a barrel this month as traders weigh the impact on demand from a potential recession, as well as a broad appetite for risk and wider market moves.
WTI hits the resistance of $100 a barrel yesterday and remained trying to break above it. The rising momentum slowed as trading volume declined during the morning session. On the hourly chart, the prices show a tendency to decline as the resistance is strengthening below $100 a barrel. Meanwhile, technical indicators confirm a possibility of a drop towards $93.70 a barrel.
On the other hand, the daily chart shows a high tendency to reach $101 a barrel before it breaks the gains and decline.
PIVOT POINT: 100.00
| SUPPORT | RESISTANCE |
| 98.30 | 101.00 |
| 96.60 | 101.95 |
| 93.70 | 102.40 |
Tags
Open Live Account
Please enter a valid country
No results found
No results found
Please enter a valid email
Please enter a valid verification code
1. 8-16 characters + numbers (0-9) 2. blend of letters (A-Z, a-z) 3. special characters (e.g, !a#S%^&)
Please enter the correct format
Please tick the checkbox to proceed
Please tick the checkbox to proceed
Important Notice
STARTRADER does not accept any applications from Australian residents.
To comply with regulatory requirements, clicking the button will redirect you to the STARTRADER website operated by STARTRADER PRIME GLOBAL PTY LTD (ABN 65 156 005 668), an authorized Australian Financial Services Licence holder (AFSL no. 421210) regulated by the Australian Securities and Investments Commission.
CONTINUEImportant Notice for Residents of the United Arab Emirates
In alignment with local regulatory requirements, individuals residing in the United Arab Emirates are requested to proceed via our dedicated regional platform at startrader.ae, which is operated by STARTRADER Global Financial Consultation & Financial Analysis L.L.C.. This entity is licensed by the UAE Securities and Commodities Authority (SCA) under License No. 20200000241, and is authorised to introduce financial services and promote financial products in the UAE.
Please click the "Continue" button below to be redirected.
CONTINUEError! Please try again.